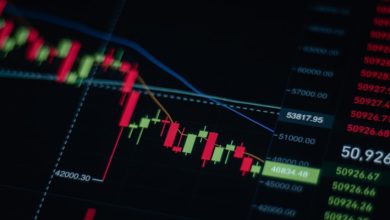
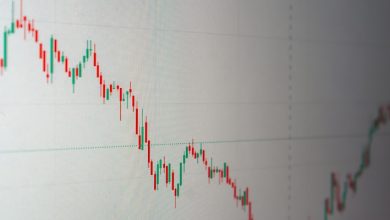
How to Spot Reversal Patterns in Crypto Charts

- Understanding the basics of reversal patterns in crypto charts
- Common reversal patterns to look out for in cryptocurrency trading
- Identifying key indicators of potential trend reversals in crypto markets
- Practical tips for spotting reversal patterns early in your chart analysis
- Exploring the significance of volume and price action in recognizing reversals
- Using technical analysis tools to confirm reversal patterns and make informed decisions
Understanding the basics of reversal patterns in crypto charts
When analyzing crypto charts, it is essential to understand the basics of reversal patterns. Reversal patterns are formations that indicate a potential change in the direction of a cryptocurrency’s price movement. By recognizing these patterns, traders can make informed decisions about when to buy or sell.
One common reversal pattern is the “head and shoulders,” which consists of three peaks – the left shoulder, head, and right shoulder. This pattern typically indicates a bullish-to-bearish trend reversal. On the other hand, the “double bottom” pattern consists of two troughs and signals a shift from a downtrend to an uptrend.
Another significant reversal pattern is the “rising wedge,” which forms when the price consolidates between two converging trendlines. This pattern suggests a potential bearish reversal, as the price is likely to break below the lower trendline. Conversely, the “falling wedge” pattern indicates a bullish reversal, with the price expected to break above the upper trendline.
Common reversal patterns to look out for in cryptocurrency trading
When trading cryptocurrencies, it is important to be able to spot reversal patterns in the price charts. These patterns can indicate a potential change in the direction of the price movement, allowing traders to make informed decisions about when to buy or sell.
There are several common reversal patterns that traders should look out for when analyzing crypto charts. These patterns can provide valuable insights into the market sentiment and help traders anticipate potential price movements.
- Head and Shoulders: This pattern is characterized by three peaks, with the middle peak (the head) being higher than the other two (the shoulders). A head and shoulders pattern can signal a trend reversal from bullish to bearish.
- Double Top/Bottom: A double top pattern occurs when the price reaches a high point twice and is unable to break through, signaling a potential trend reversal. Conversely, a double bottom pattern occurs when the price reaches a low point twice and bounces back up, indicating a possible reversal to an uptrend.
- Triple Top/Bottom: Similar to the double top/bottom pattern, the triple top/bottom pattern consists of three consecutive peaks or troughs, indicating a strong level of resistance or support that could lead to a trend reversal.
By keeping an eye out for these common reversal patterns in cryptocurrency trading, traders can improve their ability to predict market movements and make more informed trading decisions. It is important to combine technical analysis with other factors such as market trends, news, and investor sentiment to make well-rounded trading decisions.
Identifying key indicators of potential trend reversals in crypto markets
Identifying key indicators of potential trend reversals in crypto markets is crucial for traders looking to make informed decisions. One common indicator to watch for is a double top or double bottom pattern, which can signal a possible reversal in the current trend. Additionally, pay attention to the volume of trades as a sudden increase or decrease could indicate a shift in market sentiment.
Another important indicator to consider is the moving average convergence divergence (MACD) which compares two moving averages to help identify changes in momentum. A divergence between the MACD line and the price chart may suggest an upcoming trend reversal. Additionally, keeping an eye on support and resistance levels can also provide valuable insights into potential market reversals.
Furthermore, monitoring the Relative Strength Index (RSI) can help traders identify overbought or oversold conditions, which could indicate a reversal in the current trend. A sudden spike in RSI values may signal a potential trend reversal in the near future. Combining these key indicators with technical analysis tools can help traders spot potential reversal patterns in crypto charts and make more informed trading decisions.
Practical tips for spotting reversal patterns early in your chart analysis
When conducting chart analysis in the cryptocurrency market, it’s crucial to be able to spot reversal patterns early on to make informed trading decisions. By identifying these patterns, you can anticipate potential shifts in market direction and take advantage of profitable opportunities.
One practical tip for spotting reversal patterns early is to pay close attention to key support and resistance levels on the chart. Support levels indicate a price point where the asset has historically had difficulty falling below, while resistance levels show where it has struggled to rise above. When these levels are broken, it could signal a reversal in the trend.
Another useful strategy is to look for patterns such as head and shoulders, double tops, or double bottoms. These patterns often indicate a potential trend reversal, as they show a shift in momentum from buyers to sellers or vice versa. By recognizing these patterns early, you can prepare to enter or exit a trade at the right time.
Additionally, using technical indicators like moving averages, MACD, or RSI can help confirm potential reversal patterns. These indicators provide valuable insights into market dynamics and can help you validate your analysis before making a trading decision. Combining these tools with price action analysis can give you a comprehensive view of the market and increase your chances of success.
Exploring the significance of volume and price action in recognizing reversals
When it comes to spotting reversal patterns in crypto charts, paying attention to volume and price action can be crucial. Both volume and price action are key indicators that can help traders identify potential reversals in the market.
Volume refers to the number of trades executed during a specific period. High volume during a price movement indicates strong interest from traders, while low volume may suggest a lack of conviction. When looking for reversal patterns, an increase in volume as a price trend approaches a potential turning point can signal a possible reversal.
Price action, on the other hand, refers to the movement of the price itself. Reversal patterns often manifest as distinct changes in price direction, such as a series of higher highs and higher lows in an uptrend, followed by lower highs and lower lows indicating a potential reversal to a downtrend.
By combining analysis of volume and price action, traders can gain valuable insights into market sentiment and potential future price movements. Recognizing patterns that signal a reversal early on can help traders make informed decisions and capitalize on market opportunities.
Using technical analysis tools to confirm reversal patterns and make informed decisions
Utilizing technical analysis tools can be instrumental in confirming reversal patterns and aiding in making informed decisions when trading cryptocurrencies. By incorporating indicators such as moving averages, Relative Strength Index (RSI), and Bollinger Bands, traders can gain valuable insights into the market dynamics and potential price movements.
When identifying a reversal pattern in crypto charts, it is crucial to look for confirmation from these technical analysis tools. For example, if a bullish reversal pattern like a double bottom is observed, traders can use the RSI to confirm if the market is oversold, indicating a potential upward trend. Similarly, if a bearish reversal pattern like a head and shoulders pattern emerges, traders can utilize moving averages to confirm the downward trend.
By combining the visual cues from reversal patterns with the signals generated by technical analysis tools, traders can increase their confidence in their trading decisions. This approach allows for a more comprehensive understanding of market trends and helps in avoiding false signals that may lead to losses.